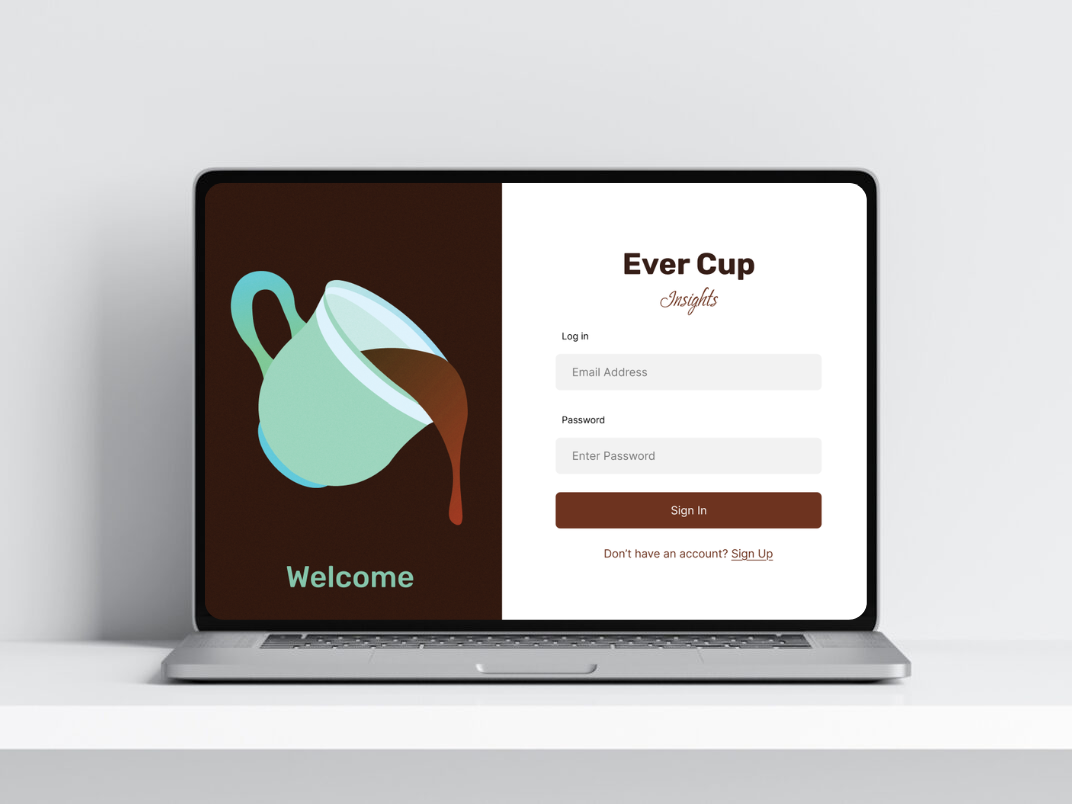
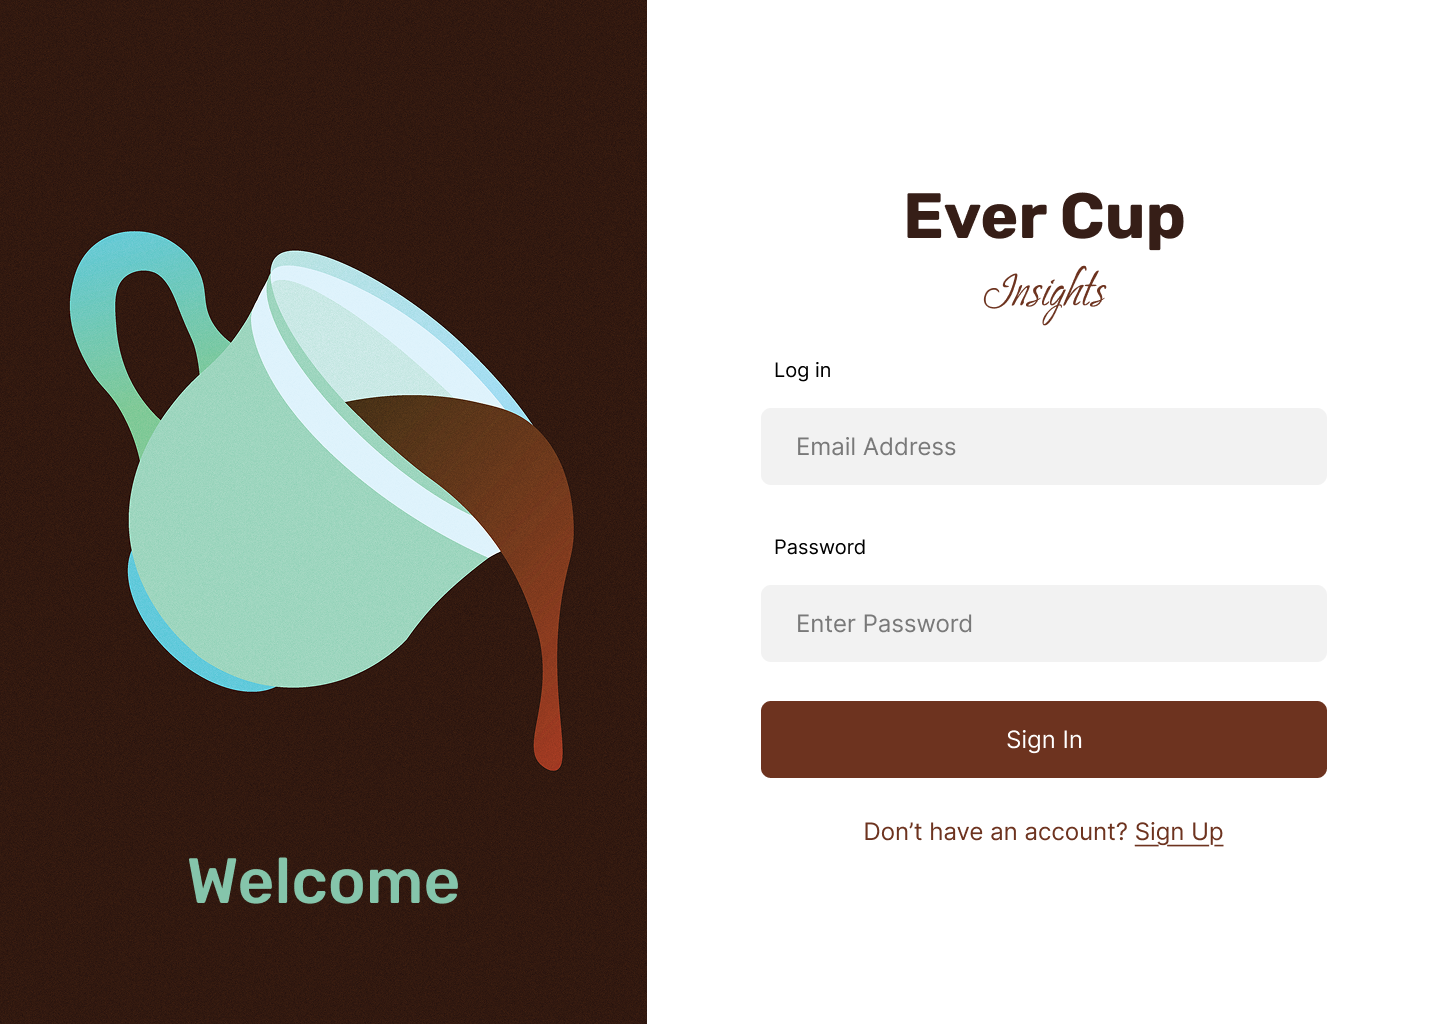
Evercup

For overachievers. For the coffee and tea lovers. For you, forever.

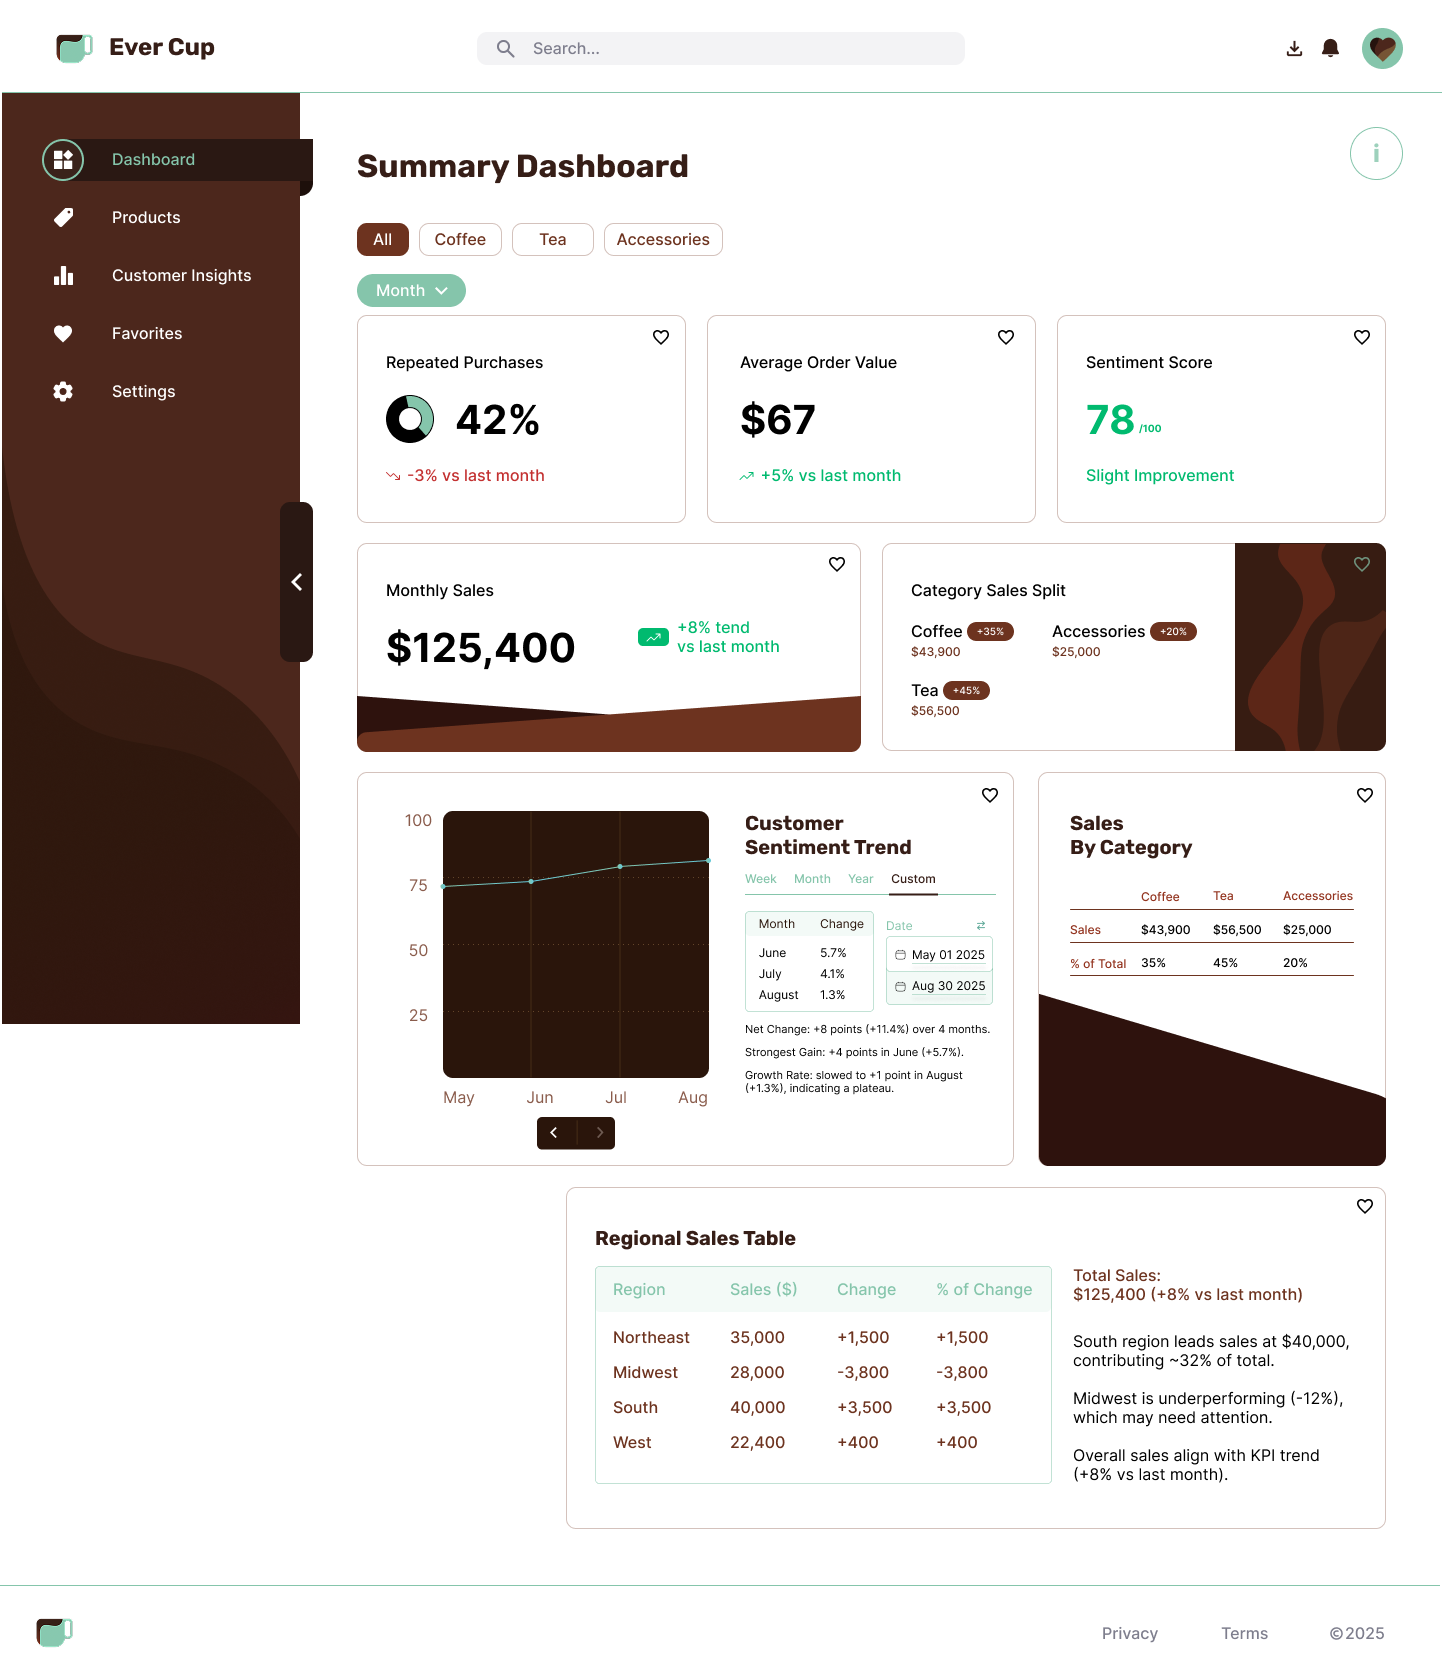
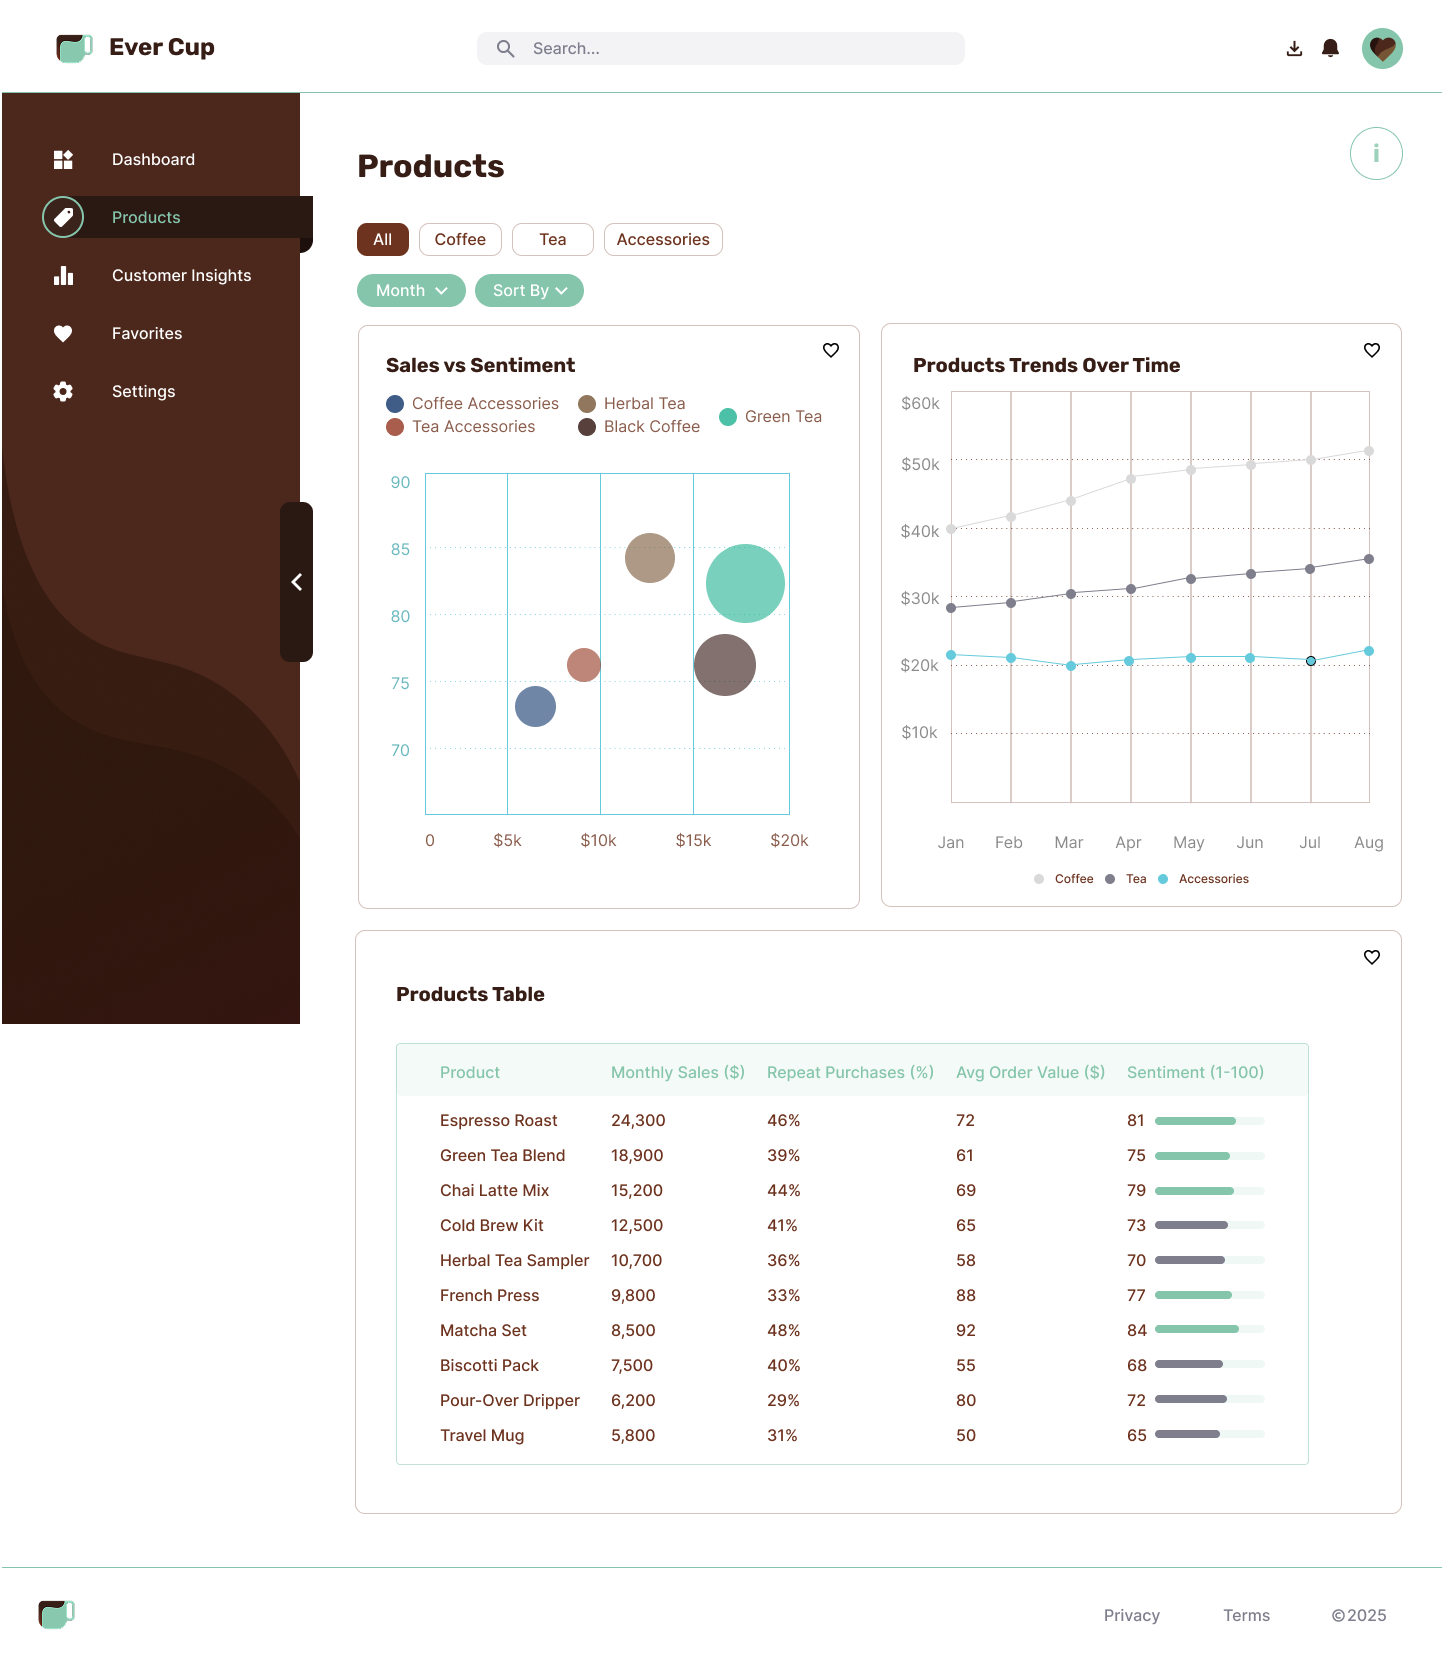
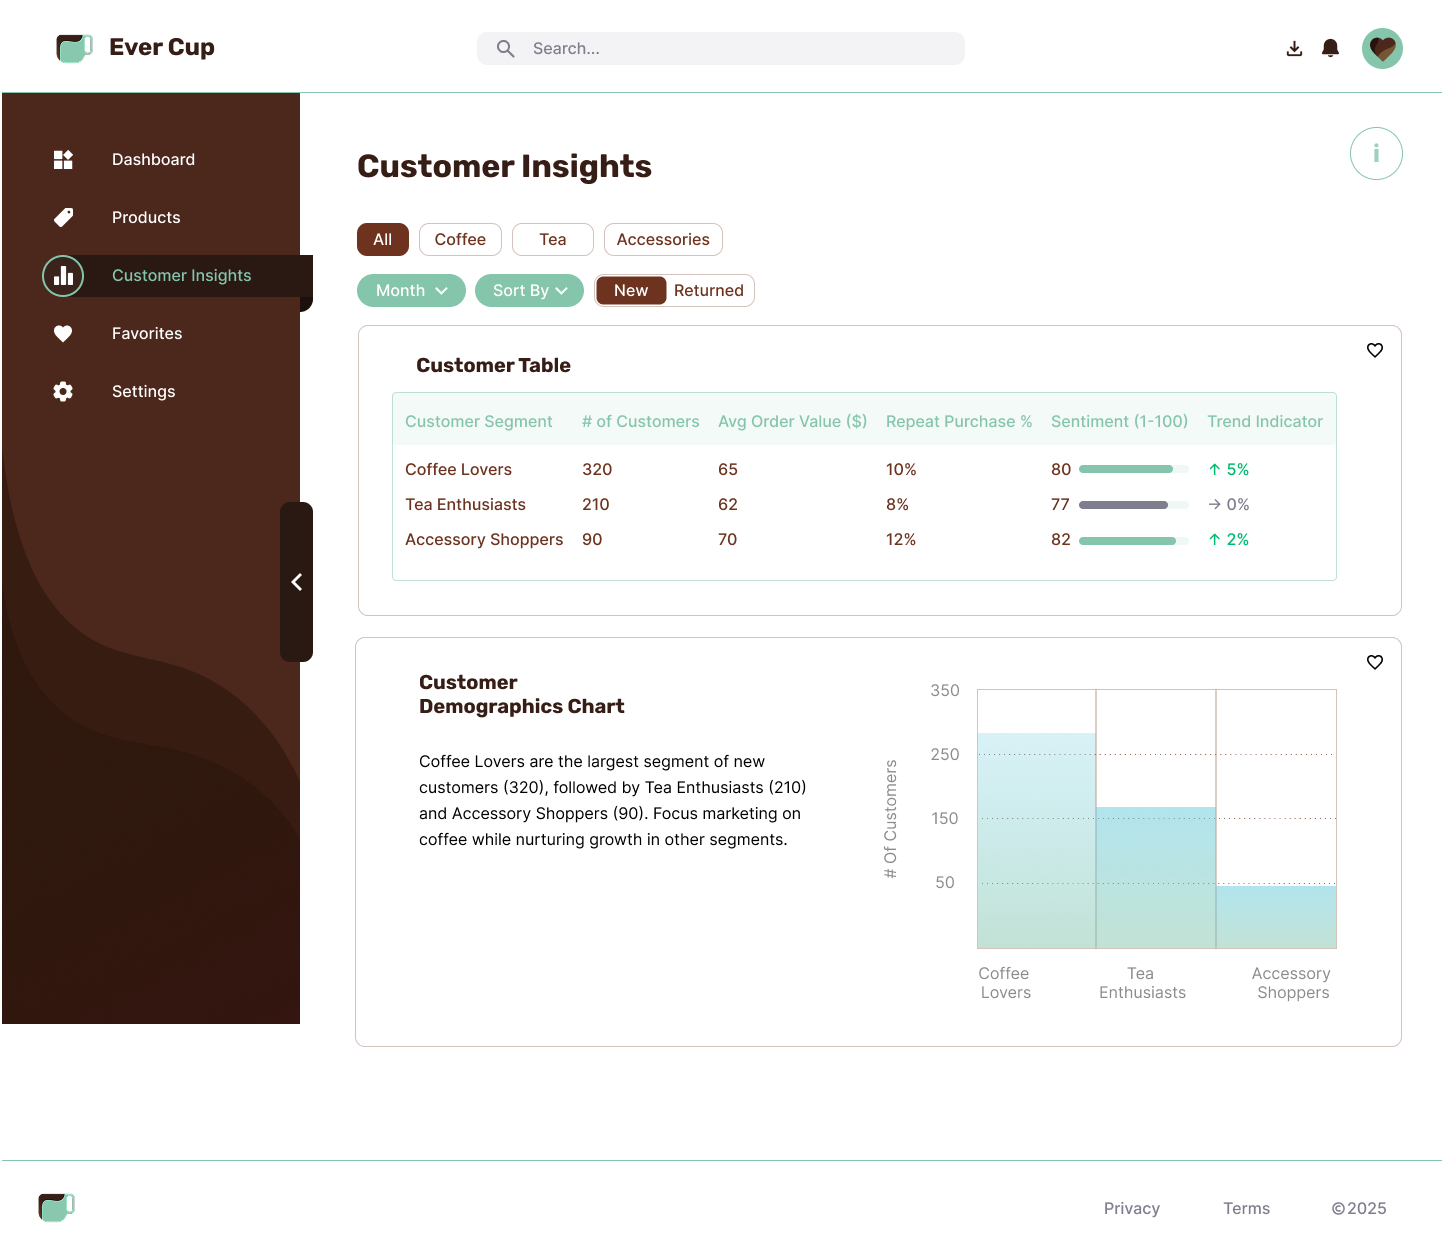
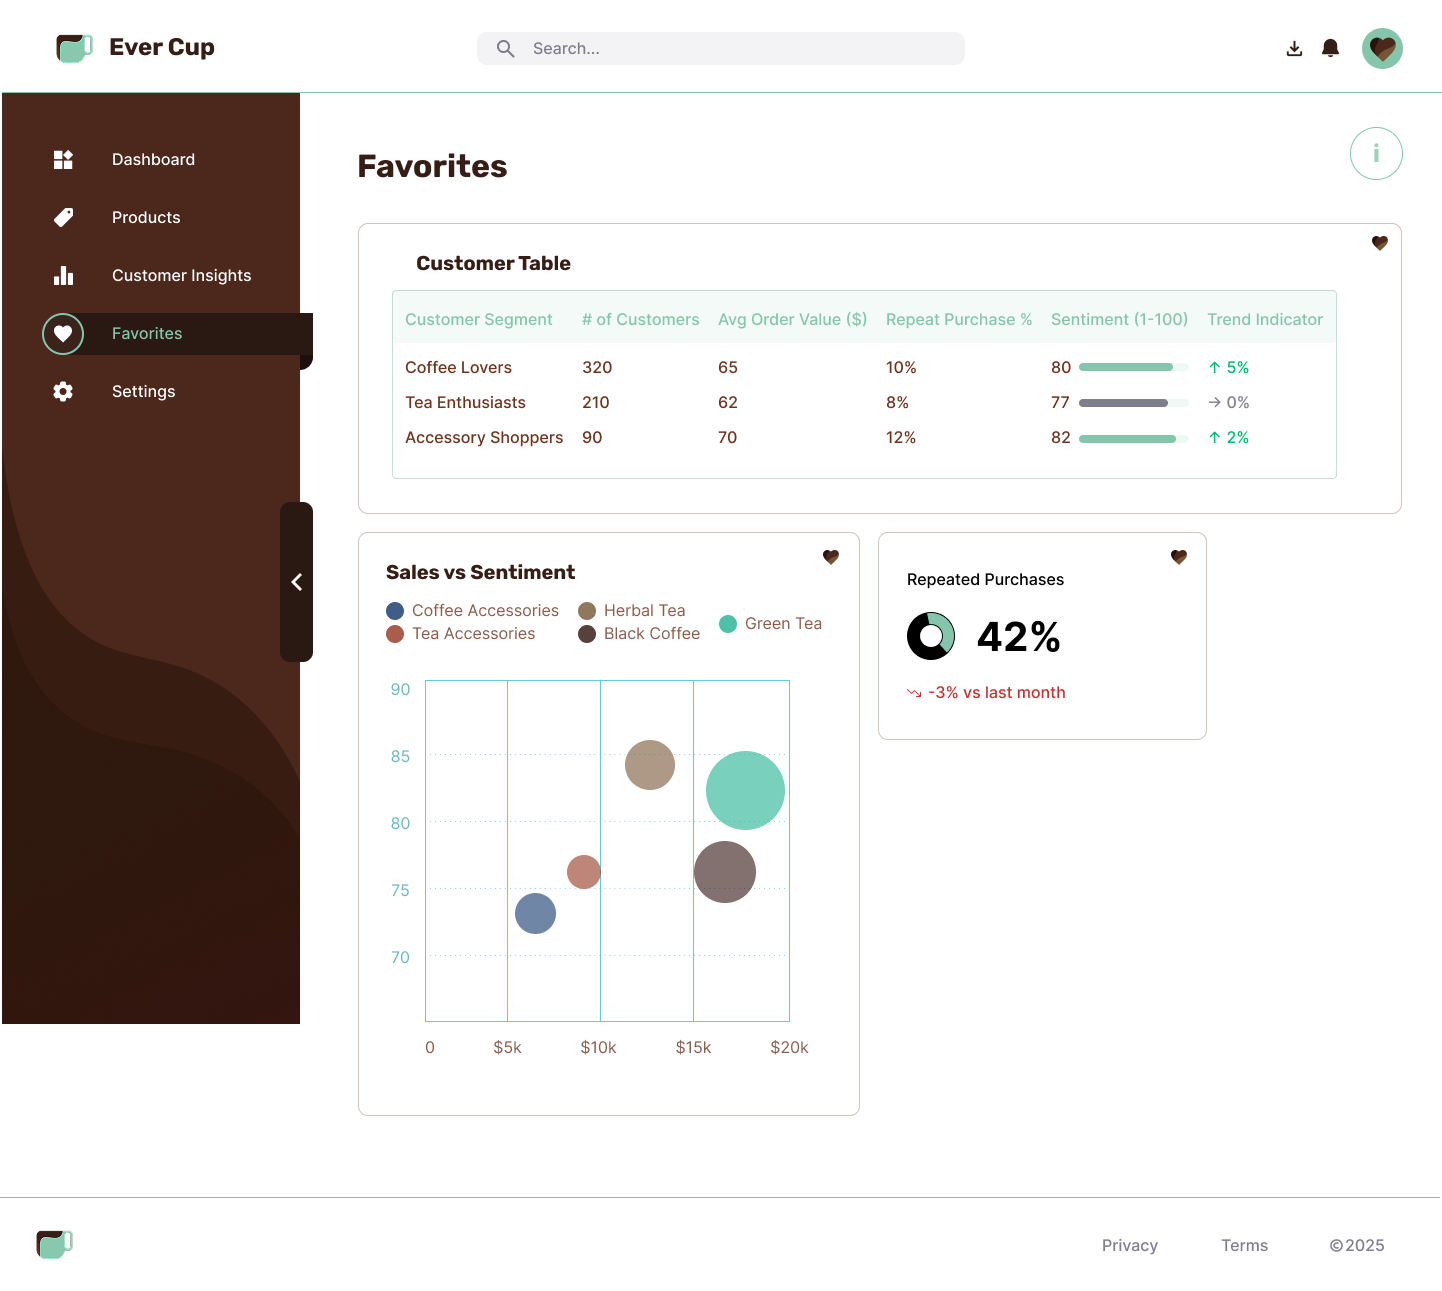
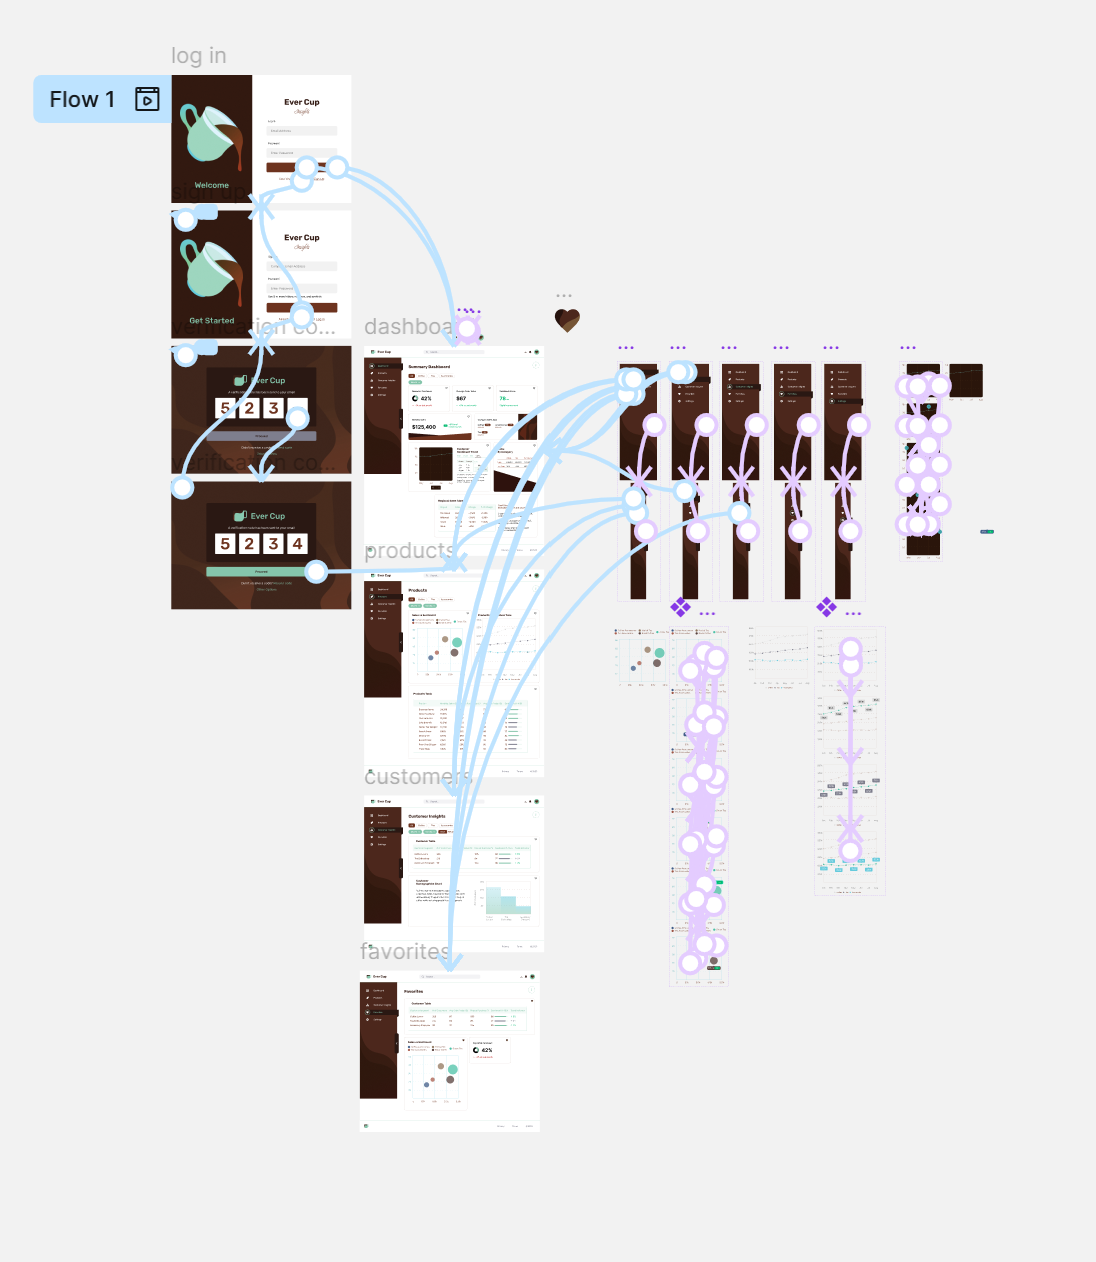
An analytics dashboard designed for a tea and coffee company, helping their finance and marketing teams visualize customer relationships and product data.

ROLE

Prototyping, UX Design, Visual Design
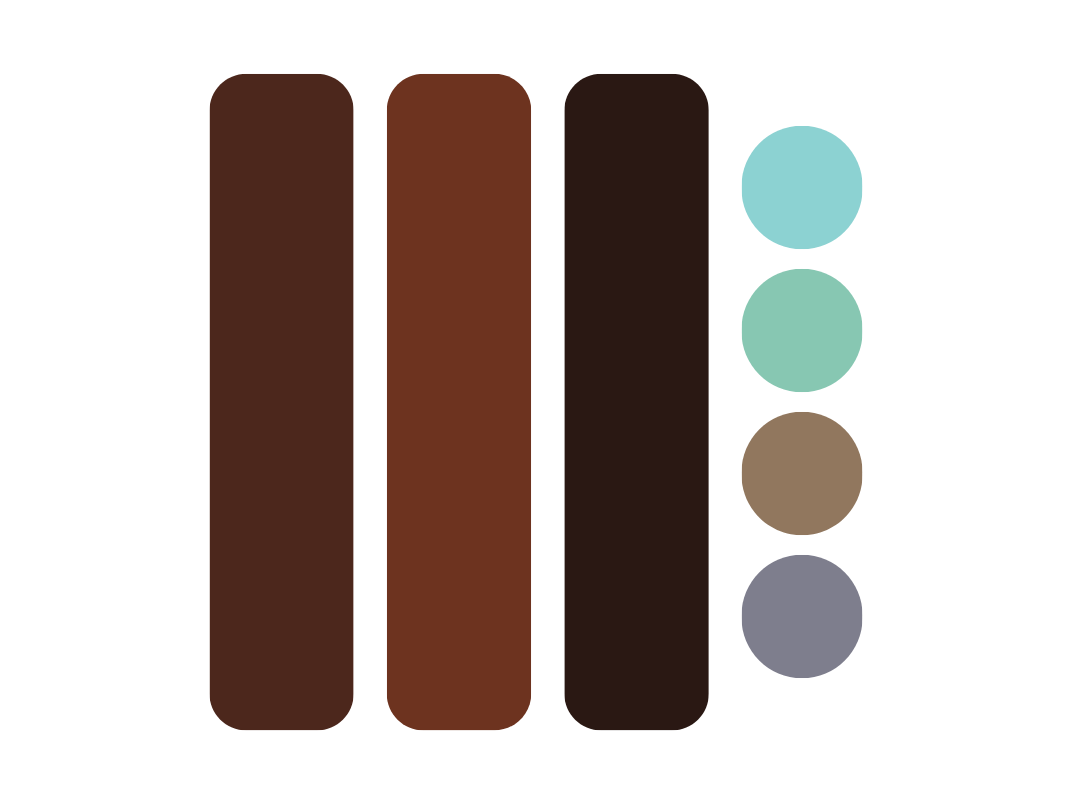
TOOLS

Figma, Illustrator

Evercup

Interactive Prototype

Explore the Evercup Insights dashboard

About Evercup

Ever Cup is a tea and coffee company that sells drinks and accessories. For this company, Ever Cup wanted a database to understand the relationships between customers and their products.

Target Users: Finance and Marketing Department of Ever Cup

Project Goals

  • Create an easy-to-read analytics dashboard in their new database, Ever Cup Insights.
  • Quickly gather data through easy navigation.
  • Create ways to customize data visualization and reports.

Branding

1. Themes of flowing liquid

2. Rounded edges

3. Rich browns and offset blues

Evercup Color Palette

Colors that resemble the blues of freshness and integrity and the browns of warmth and comfort. Few colors are grey-toned to mimic pastel colors. Grain effect for a softer look.

Design Pages

Key pages designed for the Evercup Insights dashboard:

Login Page
Sign Up Page
Verification Code
Verification Code Confirmation
Dashboard
Products Page
Customers Page
Favorites Page

Conclusion

Evercup Analytics Design

I designed a dashboard showing trend comparisons, sales, sentiment rates, returns, and customer approval metrics. My curiosity about product-customer relationships drove me to explore data visualization patterns and create a light-themed interface with intuitive navigation.